The Tray Dryer That Lives on Your Laptop
Every drying course covers the drying curve. Constant-rate period, critical moisture content, falling-rate period — three concepts, one graph, dozens of exam questions. What most courses skip is the…
Every drying course covers the drying curve. Constant-rate period, critical moisture content, falling-rate period — three concepts, one graph, dozens of exam questions.
What most courses skip is the moment you actually feel the curve change. Where you raise the heater and watch the slope steepen. Where you see the outlet temperature start to climb as the surface moisture disappears, and you think: that's the falling-rate period, right now, in front of me.
That is what PiDryer-Tray does.
A Real Process, on Any Windows PC
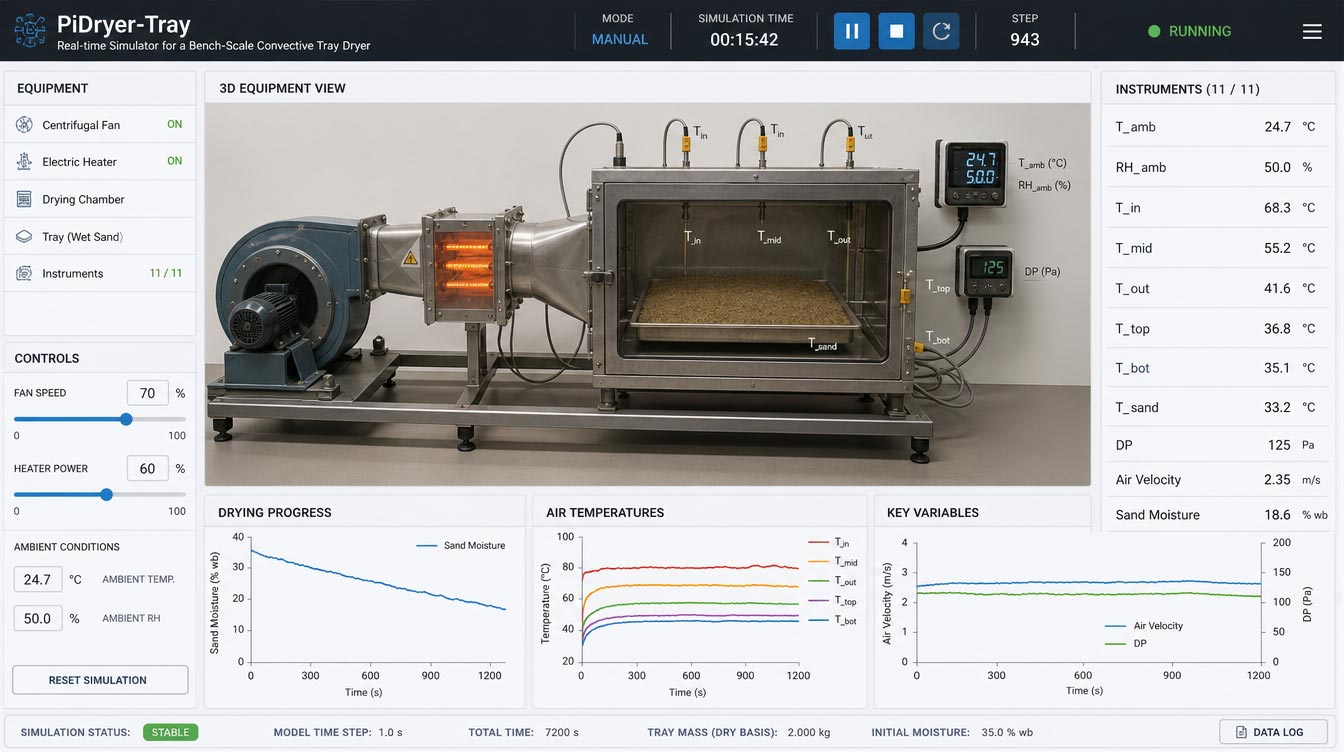
PiDryer-Tray is a real-time simulator built around the core equipment of a bench-scale convective tray dryer: a centrifugal fan, an electric heater, a tray of wet sand, and a full set of instruments that report what is happening at every simulation step.
You see temperature readings before and after the tray — both dry-bulb and wet-bulb. You see air velocity at the duct outlet. You see the digital balance reading tick downward as water leaves the sand — a live drying curve, one data point per second.
Fan speed and heater power are yours to control. The simulator responds the way real equipment does. Change the heater mid-run and the inlet temperature shifts within seconds. Push the fan higher and the balance slope responds. Everything you would see in a physical laboratory, on the screen in front of you — without the sand, without the heat, and without booking a time slot.
Here is what you get:
Live drying curve. The Wet Sand mass trend scrolls in real time — one balance reading per simulation second. Watch the slope hold steady through the constant-rate period, then flatten as the surface moisture runs out.
Full psychrometer set. Dry-bulb and wet-bulb temperatures are displayed before and after the tray, with humidity ratios computed from the ASHRAE energy-balance formula — accurate at the elevated inlet temperatures a heated dryer produces.
Air velocity and mass flow. An anemometer at the duct outlet gives you the air speed needed to calculate exactly how much air is carrying moisture out of the dryer each second.
Independent fan and heater controls. Each has its own panel with an on/off switch and a continuous dial. Set them, watch the instruments respond, and adjust — just like standing at a real control panel.
CSV export with every variable logged. Temperatures, humidity ratios, air velocity, wet sand mass — all timestamped, all in one file, ready for Excel, Python, or MATLAB the moment you stop data collection.
Configurable startup. Dry sand mass, initial water mass, and duct area are set before each run, giving you full control over initial moisture content and air flow geometry.
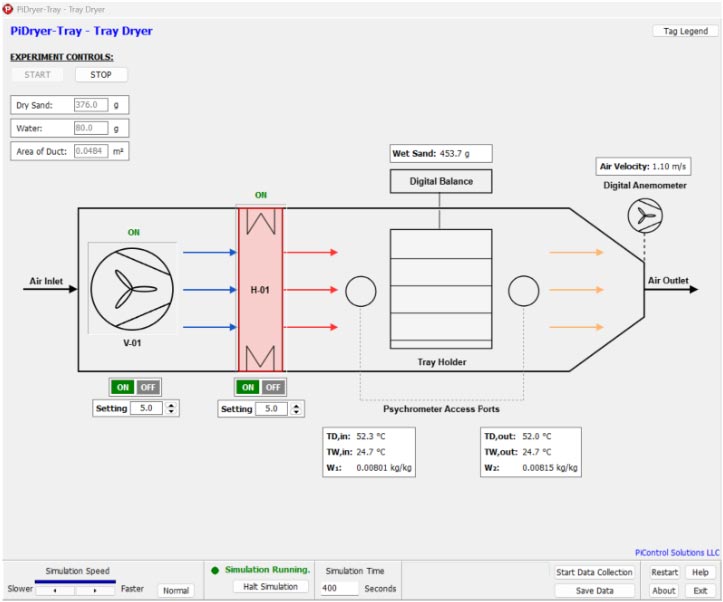
Figure 1. PiDryer-Tray simulator — P&ID process diagram with live instrument readings .
The Insight No Textbook Can Give You
Here is what most people believe about tray dryer control before they use PiDryer-Tray: more fan speed plus more heater power equals faster drying.
Here is what they discover after ten minutes in the simulator: it depends.
Push the fan higher and more air flows across the heater. That extra air pulls the temperature rise down — more mass flow, lower outlet temperature. You can end up with more air crossing the tray at a lower driving-force temperature. Whether drying speeds up or slows down depends on exactly where you started, and the only way to know is to run the numbers — or run the simulator and read the instruments directly.
Users who work through this trade-off on PiDryer-Tray remember it for the rest of their careers. Not because someone told them, but because they found it themselves.
The Drying Curve Is Not Just a Graph Anymore
In PiDryer-Tray, the drying curve is a live instrument reading. The Wet Sand mass trend scrolls across the screen in real time. During the constant-rate period, the slope is steady. Then — at a specific point — it starts to flatten. That is the falling-rate period beginning. The surface moisture is gone. The drying mechanism has changed.
This transition is invisible in a textbook. In the simulator, you see it happen. And if you change the initial water loading, you see it happen sooner or later. If you cut the heater, the slope changes and you watch the curve adjust in real time.
The heater itself behaves in a way most people do not expect: it does not deliver power linearly with the dial setting. At the midpoint, it is already at roughly 70% of its maximum output. This is how real phase-angle controlled resistance heaters behave in pilot-scale and industrial equipment — and PiDryer-Tray models it correctly. Users who notice this and investigate it leave with something textbooks rarely teach: the gap between "the dial says 5" and "half the power."
Data You Can Actually Use
Every simulation step is logged. At the end of a run, you export a timestamped CSV file containing temperatures, humidity readings, air velocity, and the wet sand mass — everything you need for a complete drying experiment analysis, ready for Excel, Python, or MATLAB.
The data gives you two independent paths to the evaporation rate: one from what the air picks up as it crosses the tray, and one from the slope of the balance reading. Working out why those two estimates agree — or why they sometimes do not — is one of the most practical exercises in applied drying, and PiDryer-Tray delivers the data for it in minutes.
The simulator also includes a psychrometric model that performs correctly at the elevated air temperatures a heated tray dryer produces — conditions where the formulas in many standard textbooks quietly stop being accurate. The reading your simulator gives you is the reading a properly instrumented laboratory rig would give you.
Built for Courses, Training, and Independent Study
Universities use PiDryer-Tray as a physical lab replacement or supplement. The full drying curve experiment, mass balance closure, and psychrometric verification fit comfortably in a single three-hour session — and students can repeat the run as many times as they need, something impossible with shared physical equipment.
Training departments use it to give engineers and technicians their first real look at a tray dryer before they work on plant equipment. No heat, no sand, no cleanup — just the experience of operating the process, reading the instruments, and understanding what the numbers mean.
Engineers use it to explore operating conditions before making recommendations on real dryers. A few minutes in the simulator, a CSV export, a quick analysis — and you have data to back up a recommendation that would otherwise have required a production trial.
PiDryer-Tray is part of the PiControl Solutions laboratory simulator portfolio, which includes simulators for packed absorption columns, double-effect evaporators, wet cooling towers, and heat exchangers. Each simulator models a different unit operation with the same approach: physics-based, real-time, instrument-panel style, and configurable without touching source code.
Ready to Add a Tray Dryer to Your Toolkit?
PiDryer-Tray runs on any Windows PC. No installation server, no internet connection required, no IT department. It installs in minutes and runs immediately.
To request a demo or ask about pricing, contact info@PiControlSolutions.com or visit www.picontrolsolutions.com. If you want to see it in action first, ask about a live online walkthrough.
References
1. McCabe, W.L., Smith, J.C., and Harriott, P., Unit Operations of Chemical Engineering, 7th ed., McGraw-Hill, 2005, Chapter 24: Drying of Solids.
2. Geankoplis, C.J., Transport Processes and Separation Process Principles, 4th ed., Prentice Hall, 2003, Chapter 9: Drying of Process Materials.
3. ASHRAE, 2021 ASHRAE Handbook — Fundamentals, Chapter 1: Psychrometrics, American Society of Heating, Refrigerating and Air-Conditioning Engineers, 2021.
4. PiControl Solutions LLC, "PiDryer-Tray — Real-Time Tray Dryer Simulator," www.picontrolsolutions.com, 2026.